
Thoughtcloud / Consumer brand / 2018–2019
One creative direction.
Many ways to connect.
At Thoughtcloud, I brought seasonal sales, social content, product launches, ambassador relationships, and video into a coordinated campaign approach.
As Senior Social Media Manager, I worked across creative and execution: developing campaign ideas, writing copy, coordinating assets, and collaborating with the people bringing the brand to life.
From the original campaign reports
versus the matching prior-year period
promotion week versus prior week
the February giveaway window
Different measures and reporting windows, detailed below. The original Google Docs reports are linked throughout this case study.
- Role
- Senior Social Media Manager
- Focus
- Campaign strategy, creative direction & audience growth
- Channels
- Social, email, affiliates, paid promotion, web & video
01 / Seasonal campaigns
Give the sale a story.
Carry it everywhere.
I led the creative and sales strategy for seasonal campaigns including Spring Rejuvenation, Endless Summer, and the May promotion. Each needed a clear offer, a recognizable creative direction, and coordinated delivery across the brand’s channels.
I developed concepts and copy, managed asset delivery, and worked with web developers, the newsletter team, writers, graphic designers, and brand ambassadors. That coordination connected the social post to the rest of the customer experience.
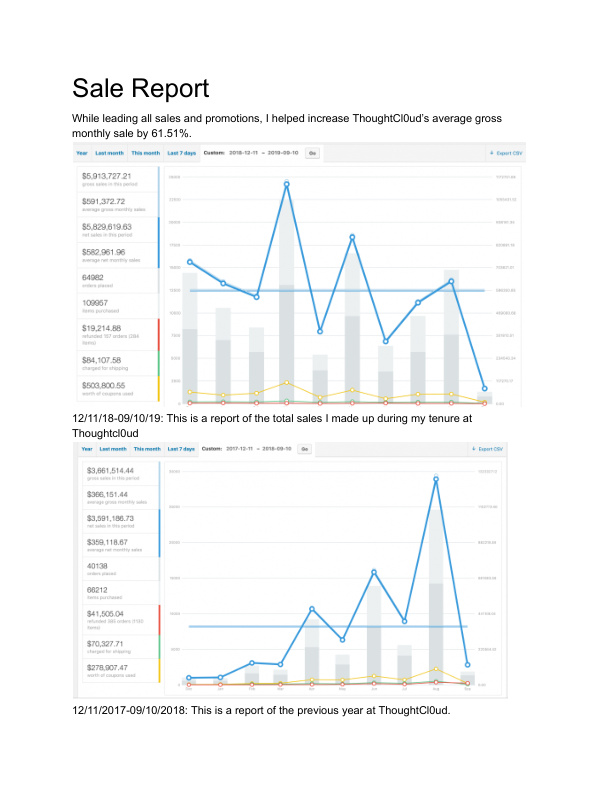
The original sales report includes store analytics for December 11, 2018–September 10, 2019 and the matching dates one year earlier. Average gross monthly sales increased from $366,151.44 to $591,372.72, a 61.51% increase.
Read the original sales report ↗Store-level results during the engagement. Gross sales are the dashboard’s reported measure; they are not net profit or revenue attributed to one campaign.
View the original store analytics screenshots
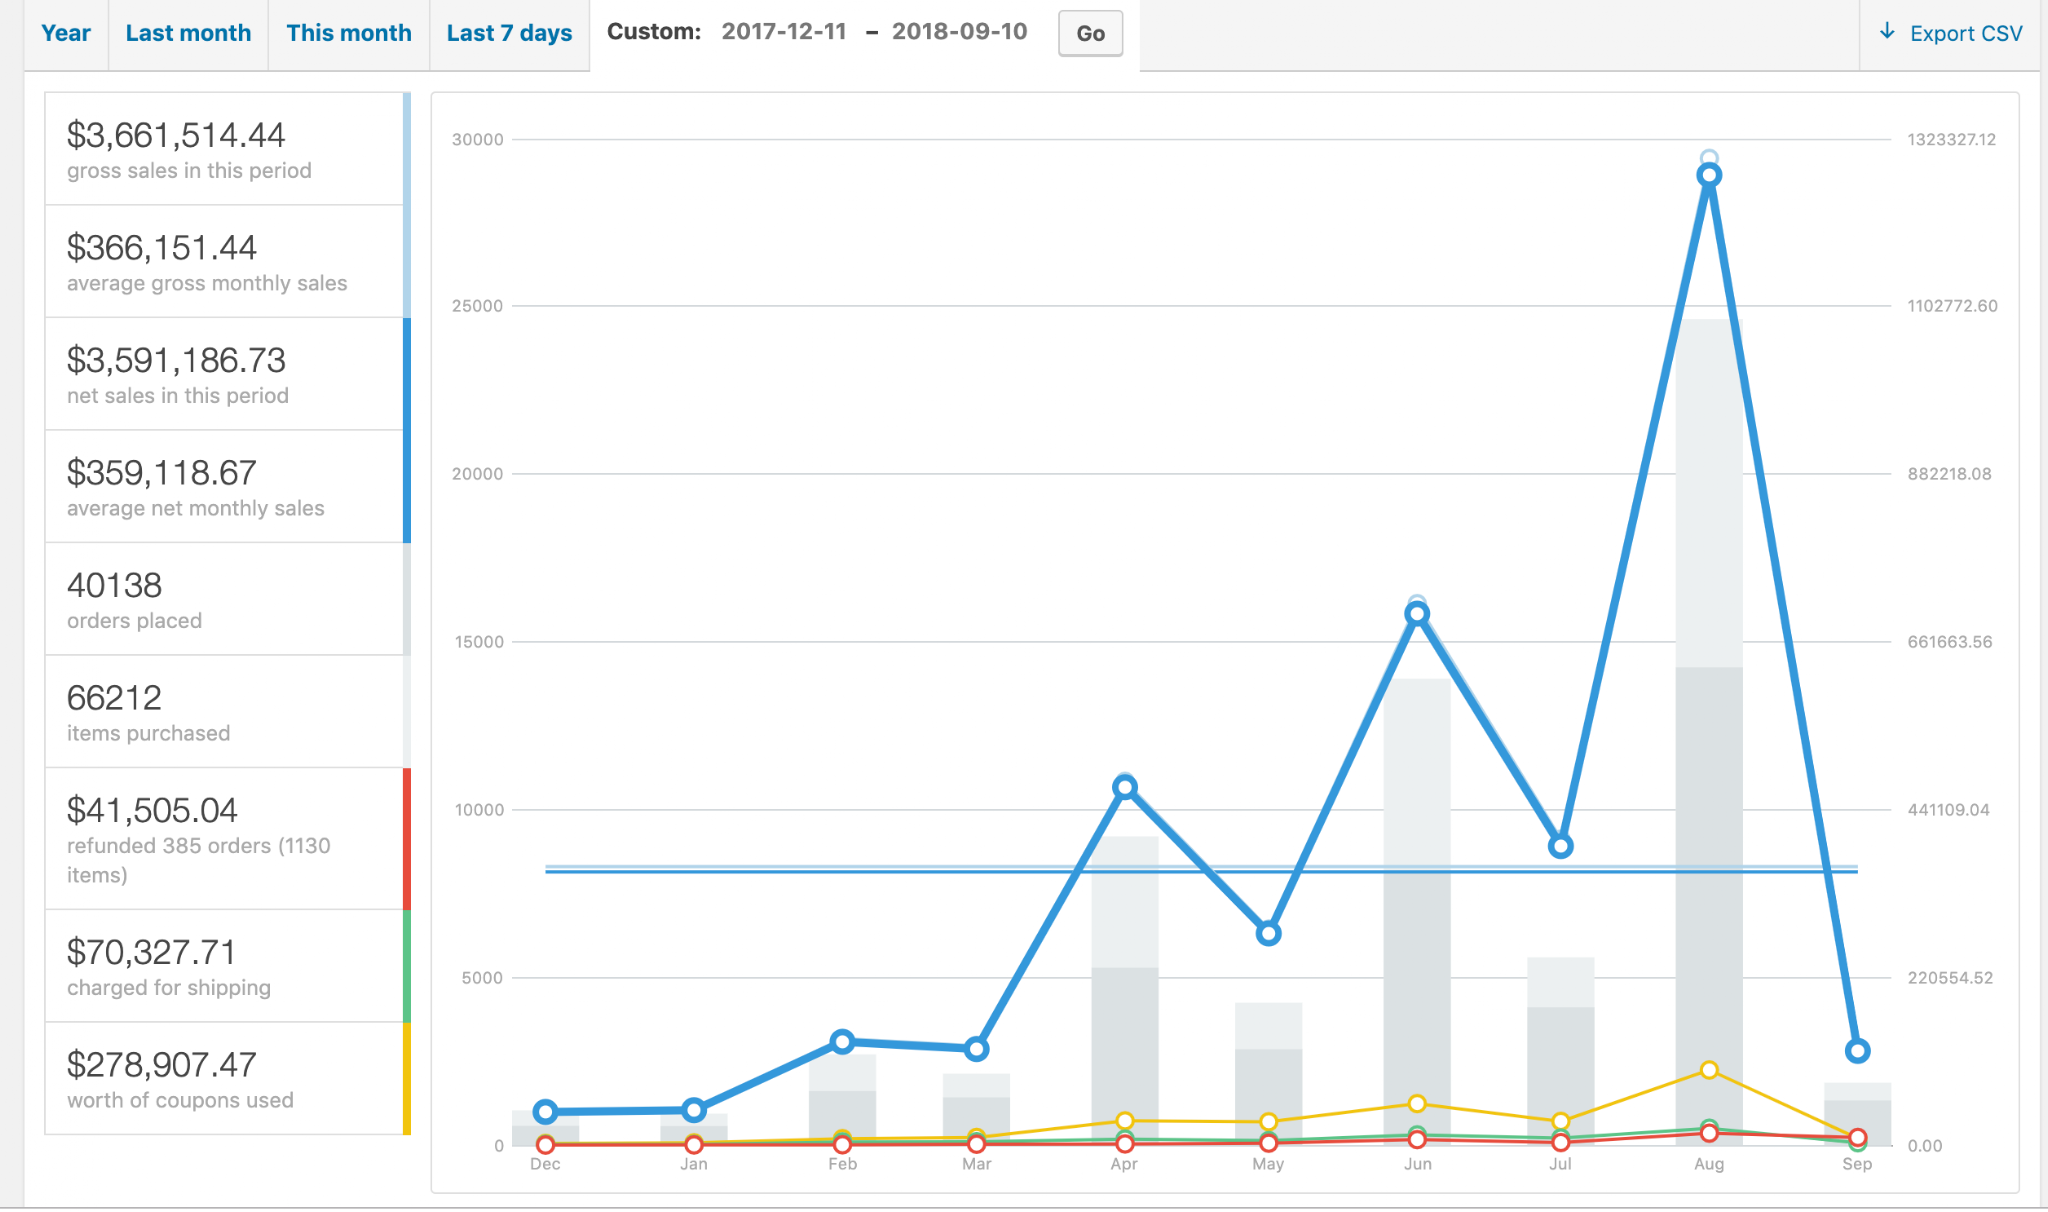
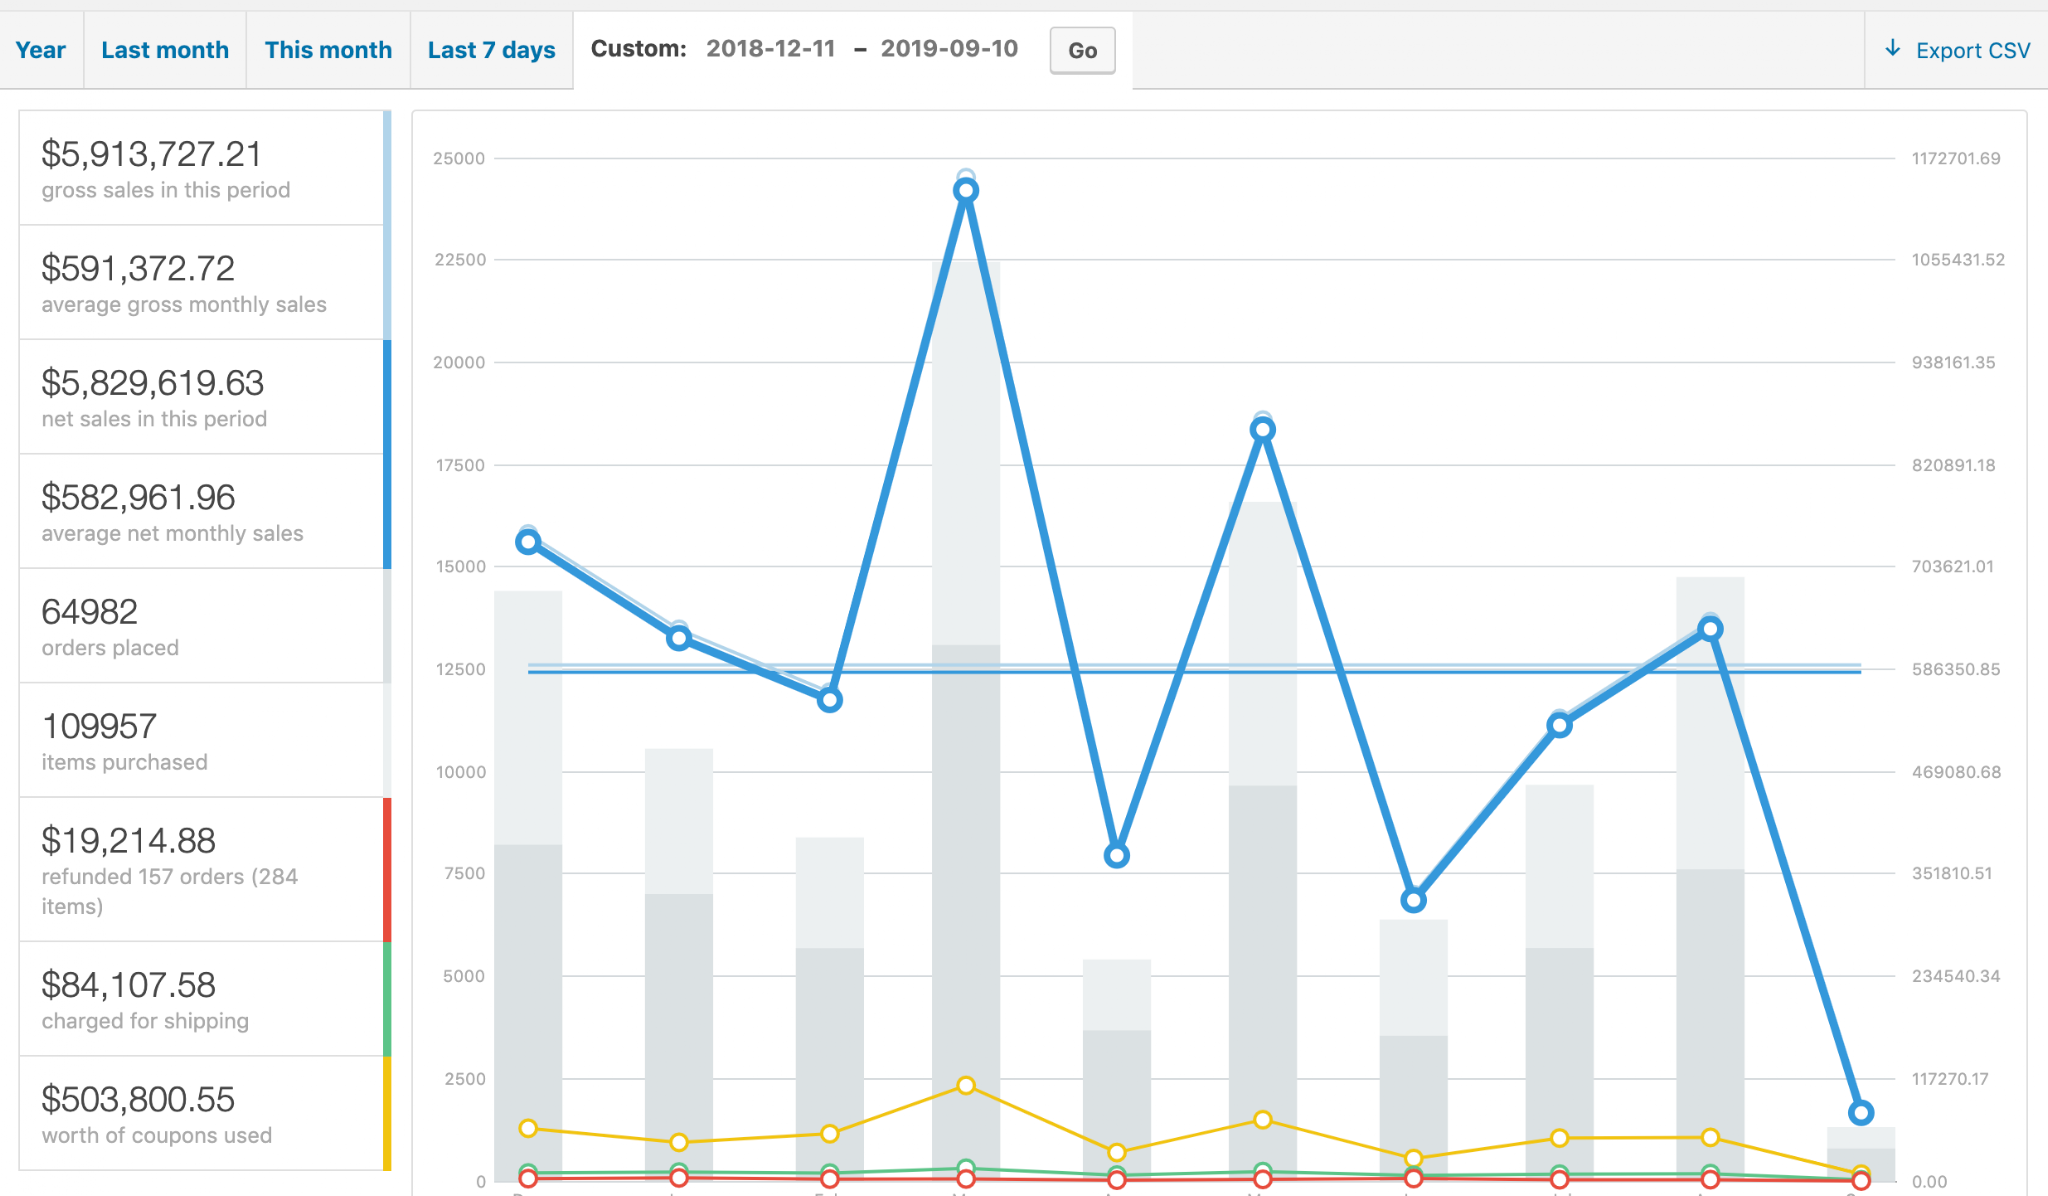
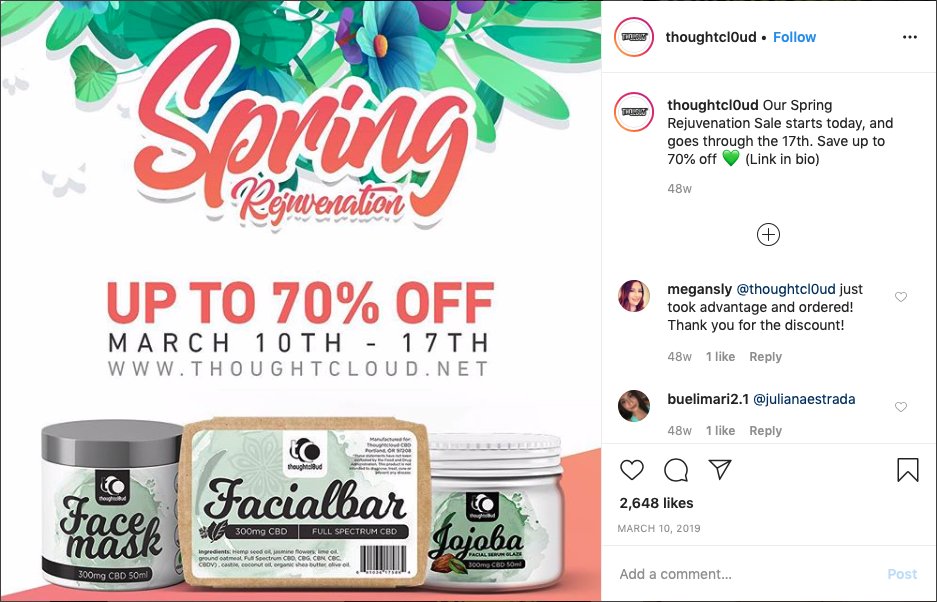
Creative & sales strategy, copy, and asset coordination.
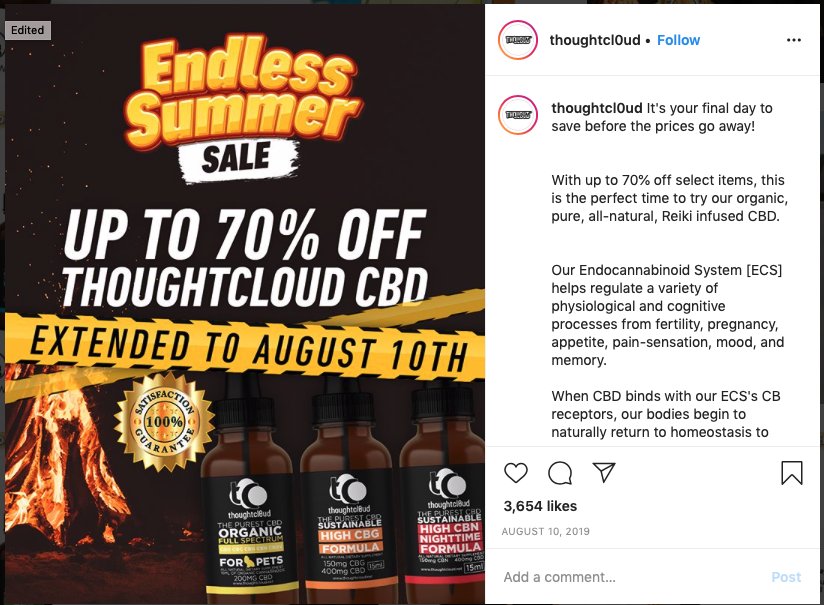
Seasonal campaign concept and coordinated delivery.
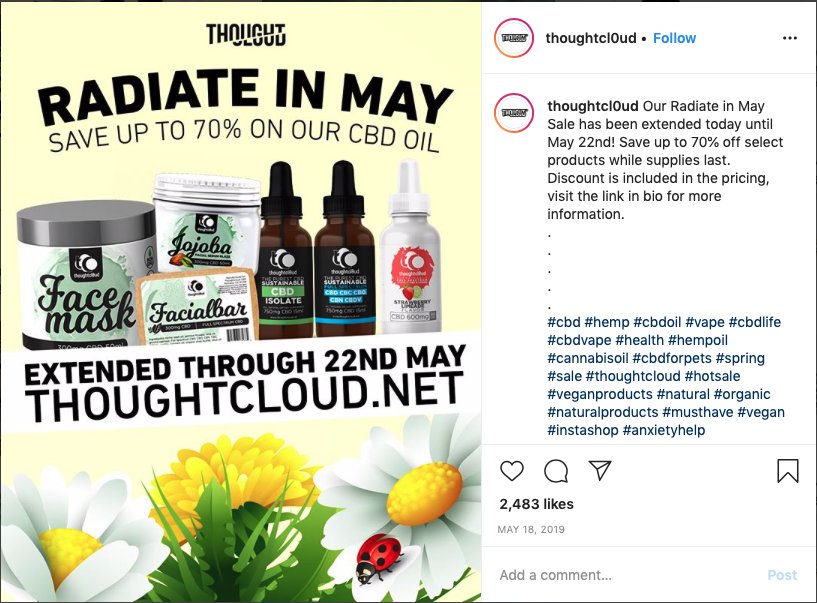
Another expression of the seasonal promotion program.
Connect creative direction with execution so the offer, copy, imagery, and timing work together across channels.
02 / Product showcase results
A focused offer.
A measurable response.
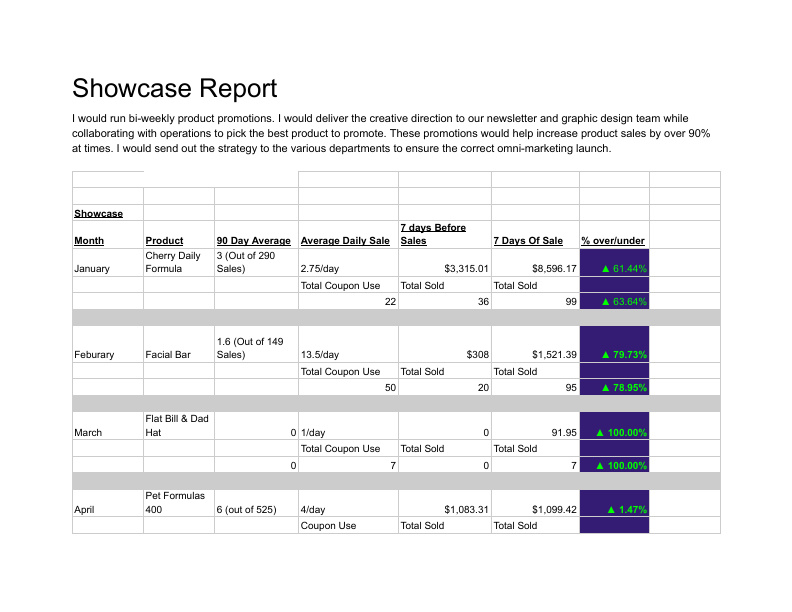
I ran product promotions, working with operations to choose the products and giving creative direction to the newsletter and design teams. I coordinated the strategy across departments so the offer, assets, and timing lined up.
The showcase report compares each product’s sales in the seven days before a promotion with the seven days of the sale. Those comparisons make the impact of the work much more concrete.
Read the product showcase report ↗June 26 / Isolate 1500
$26,941.99reported product sales during the promotion week
$2,950.45 → $26,941.99
Sales were 9.1× the preceding week, with units sold moving from 26 to 355. The report connects the campaign to a specific product, time window, and observed result.
Sales during the promotion ÷ sales in the preceding seven days. A before-and-after comparison, not an estimate of incremental profit.
Scroll the table to see all results →
| Promotion | Prior 7 days | Sale 7 days | Sales multiple | Units before → during |
|---|---|---|---|---|
| Cherry Daily FormulaJanuary | $3,315.01 | $8,596.17 | 2.6× | 36 → 99 |
| Facial BarFebruary | $308.00 | $1,521.39 | 4.9× | 20 → 95 |
| Facial BarJune 12 | $306.68 | $3,614.81 | 11.8× | 17 → 233 |
| Bath BombJune 19 | $719.20 | $8,332.45 | 11.6× | 80 → 1,399 |
| Isolate 1500June 26 | $2,950.45 | $26,941.99 | 9.1× | 26 → 355 |
| Face MasksAugust 3 | $299.92 | $4,544.20 | 15.2× | 8 → 119 |
Selected examples from the linked report. Multiples are calculated from the original dollar amounts and rounded to one decimal. The full report includes additional promotions and smaller changes.
03 / Giveaway results
Invite participation.
Grow the audience.
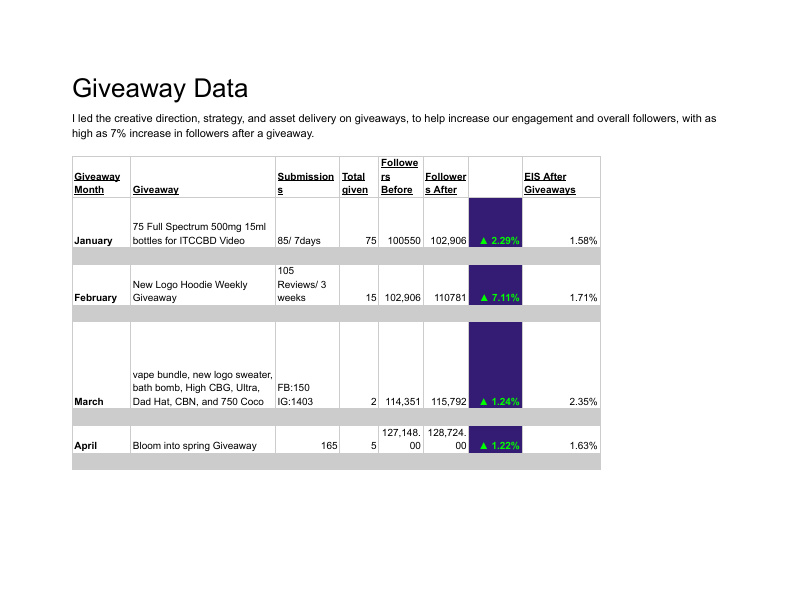
I led giveaway creative direction, strategy, and asset delivery, using different formats to encourage participation: video submissions, reviews, and social entries.
The February hoodie giveaway recorded 105 reviews across three weeks. The Summer Solstice giveaway recorded 1,503 Instagram submissions and 159 Facebook submissions. The report tracks follower counts before and after each activation.
Read the giveaway report ↗followers across the February giveaway window
102,906 before → 110,781 after
Summer Solstice submissions
1,503 on Instagram + 159 on Facebook
Scroll the table to see all results →
| Giveaway | Before | After | Net change |
|---|---|---|---|
| January video giveaway | 100,550 | 102,906 | +2,356 |
| February hoodie giveaway | 102,906 | 110,781 | +7,875 |
| March bundle giveaway | 114,351 | 115,792 | +1,441 |
| April spring giveaway | 127,148 | 128,724 | +1,576 |
| June Summer Solstice | 138,122 | 140,586 | +2,464 |
| August giveaway | 151,777 | 153,236 | +1,459 |
Net change = after minus before. These are changes during the recorded windows; other activity may also have contributed. Submissions are entries, not necessarily unique people. The separate windows are not summed into an annual growth claim.
04 / Brand ambassador results
Relationships that
extend the campaign.
I managed ambassador and affiliate relationships, including recruiting, planning collaborations, coordinating product delivery, newsletters, tracking, and payouts. The goal was to give partners the materials and information they needed to participate in the brand’s campaigns.
The original ambassador report compares total reported sales across sale and non-sale periods and tracks the top 20 ambassadors. It shows how partner performance was reviewed alongside the promotional calendar.
Read the brand ambassador report ↗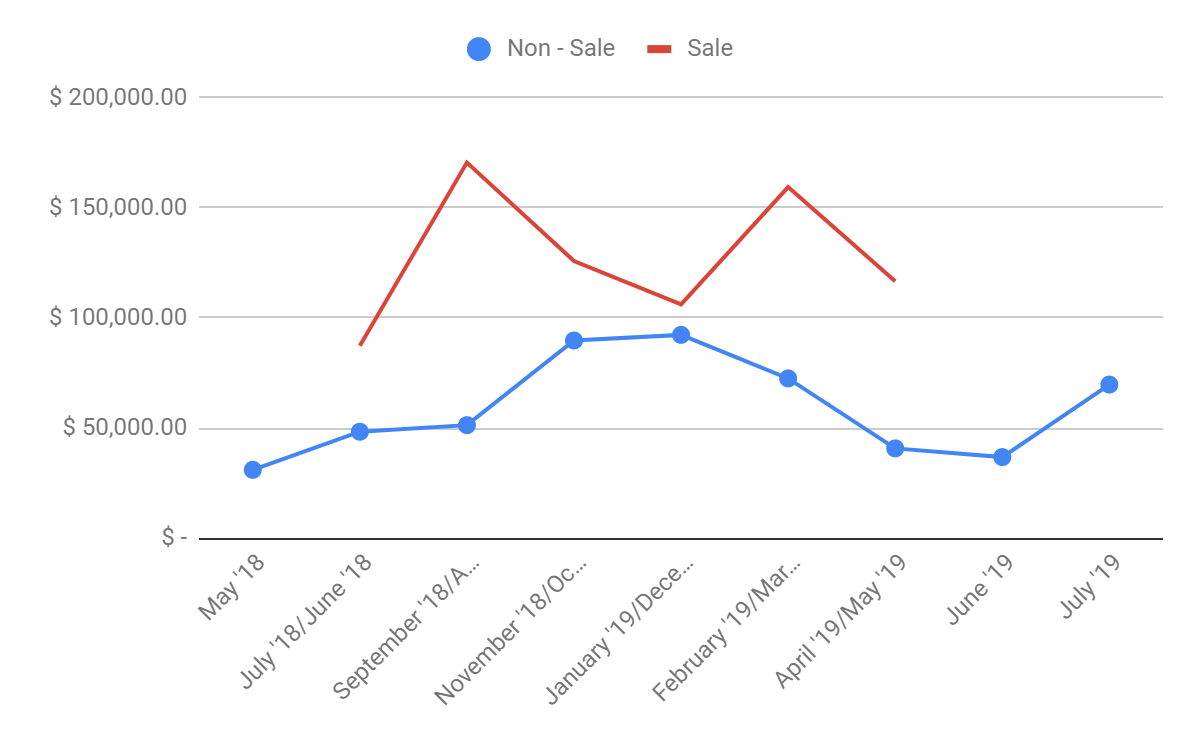
The original records
See the work.
Read the results.
These are the four Google Docs reports linked from my original Thoughtcloud portfolio. Open a report to see the source screenshots, tables, and comparisons.
05 / Branded film
A brand story
in motion.
I also directed Thoughtcloud’s Reiki film, bringing a filmmaking perspective to the brand’s content.
The film and campaign work show two sides of the same practice: finding an idea that fits the audience, then choosing the form that brings it to life.
Creative that carries
the whole campaign.
This work combined hands-on production with coordination across creative teams, commercial priorities, and audience relationships.
About the results & calculations
The figures on this page come from the four original Google Docs reports linked above, reviewed in November 2026. Sales dashboards compare December 11, 2018–September 10, 2019 with December 11, 2017–September 10, 2018. Average gross monthly sales increased by 61.51%, calculated using the prior-period value as the baseline.
Product sales multiples are the seven-day sale amount divided by the preceding seven-day amount, rounded to one decimal. Giveaway net changes are after minus before. Some percentage columns in the archived showcase and giveaway reports divide the change by the ending value; this page uses the underlying amounts and counts with the formulas stated beside each comparison.
These are observed before-and-after or period comparisons. Other activity, pricing, seasonality, and discounts may affect results. They do not establish incremental revenue, profit, or isolated campaign causation. The ambassador chart includes 2018 benchmarks before my December 2018–December 2019 role; those earlier months are context, not work attributed to me.
Creative was developed in collaboration with designers, writers, web developers, the newsletter team, operations, and brand ambassadors. The archive preserves the original reports while making the results easier to explore.
Have a challenge in mind?
Let’s make
a connection.
For marketing strategy, creative direction, campaigns, and brand storytelling. Based in the Austin, Texas area.
me@jonnycantrell.com